Exclusives from Affmy with PropellerAds in US with 25% ROI
Hey everyone! Today we will show you another case from our mediabuy team. This time we have driven 2 tours of our exclusive offer WeMeetToday from push network PropellerAds and have got a good result. So make tea and go ahead reading this useful information!
Traffic Source: PropellerAds
Advertising format: Push notifications
Period: 17.06.2021 - 30.06.2021
Network: Affmy
Offers: WeMeetToday 1 and 2 tour
Cost: $693.78
Revenue: $873
Profit: $179.22
ROI: 25,83%
How to choose a traffic source
We recommend media buyers testing different ad networks as it can considerably increase the profit. We have already tested many networks, and it’s PropellerAds’ turn. What are the advantages?
● Minimum CPC – $0.001
● You can set targeting according to interests, gender and age for Gold and Platinum accounts. But soon this function will be available for all types of accounts.
● You can add macros and mention the city of a certain user in a creative to increase relevance.
● You can set targeting according to groups of user activity (PropellerAds system analyzes users and specifies who was active and to what extent).
How to set a tracker
When you work with push ads, certainly use a tracker, it will help you monitor different statistics summaries for timely optimization of ad campaigns. To start working, you should add a traffic source and offers, where you are going to drive traffic.
To add a traffic source go to “Sources” tab and click on “Create”.

Then we enter the name – PropellerAds – and parameters, which can be set in the network:
● Banner ID;
● OS;
● Country;
● Cost;
● Zone ID;
● User activity;
● Zone type;
● Click ID}.
These metrics will help us monitor different stats summaries and optimize the campaigns.
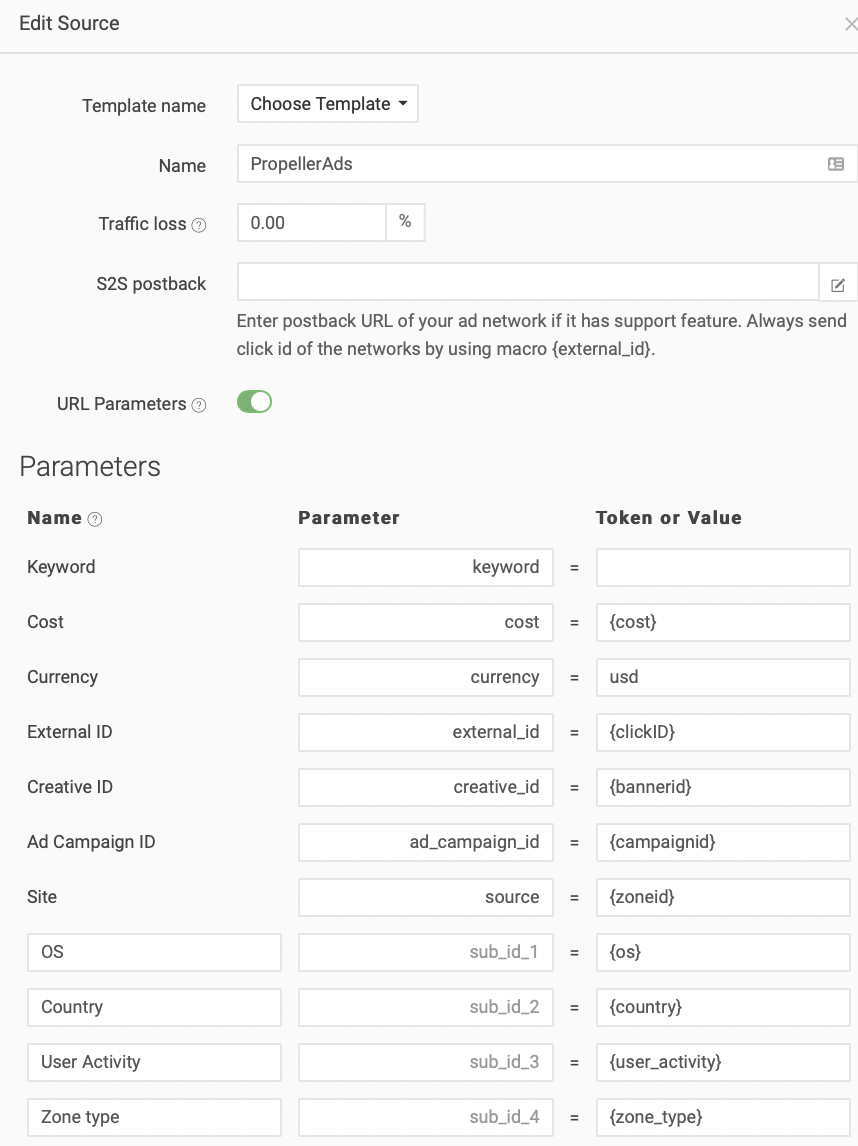
Note: Traffic loss as a default is 0%. This parameter reflects a percentage of traffic, which is lost when it goes from an ad network. It means that the amount of clicks, shown in the tracker, may differ from the amount shown in the stats of the ad network. That’s why a delta fluctuates, and the actual cost can differ from the one shown in the tracker.
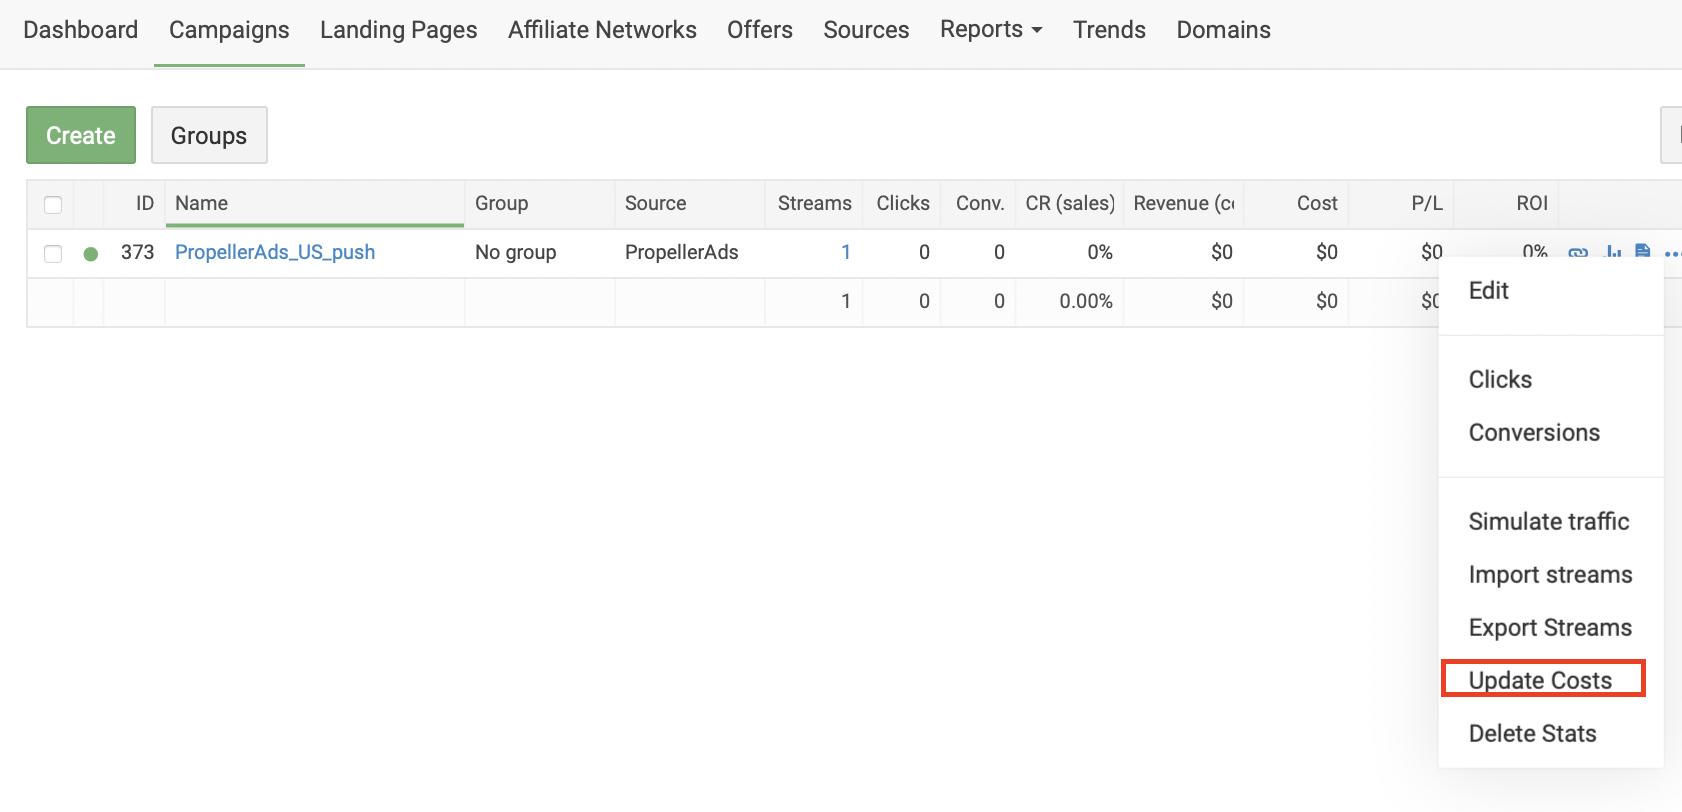
Cost can be updated with the help of the tracker. To do this, click on three dots near “Campaign” tab, then click on“Update costs” and fill in the Cost field. You can repeat it daily, weekly or choose other suitable intervals.
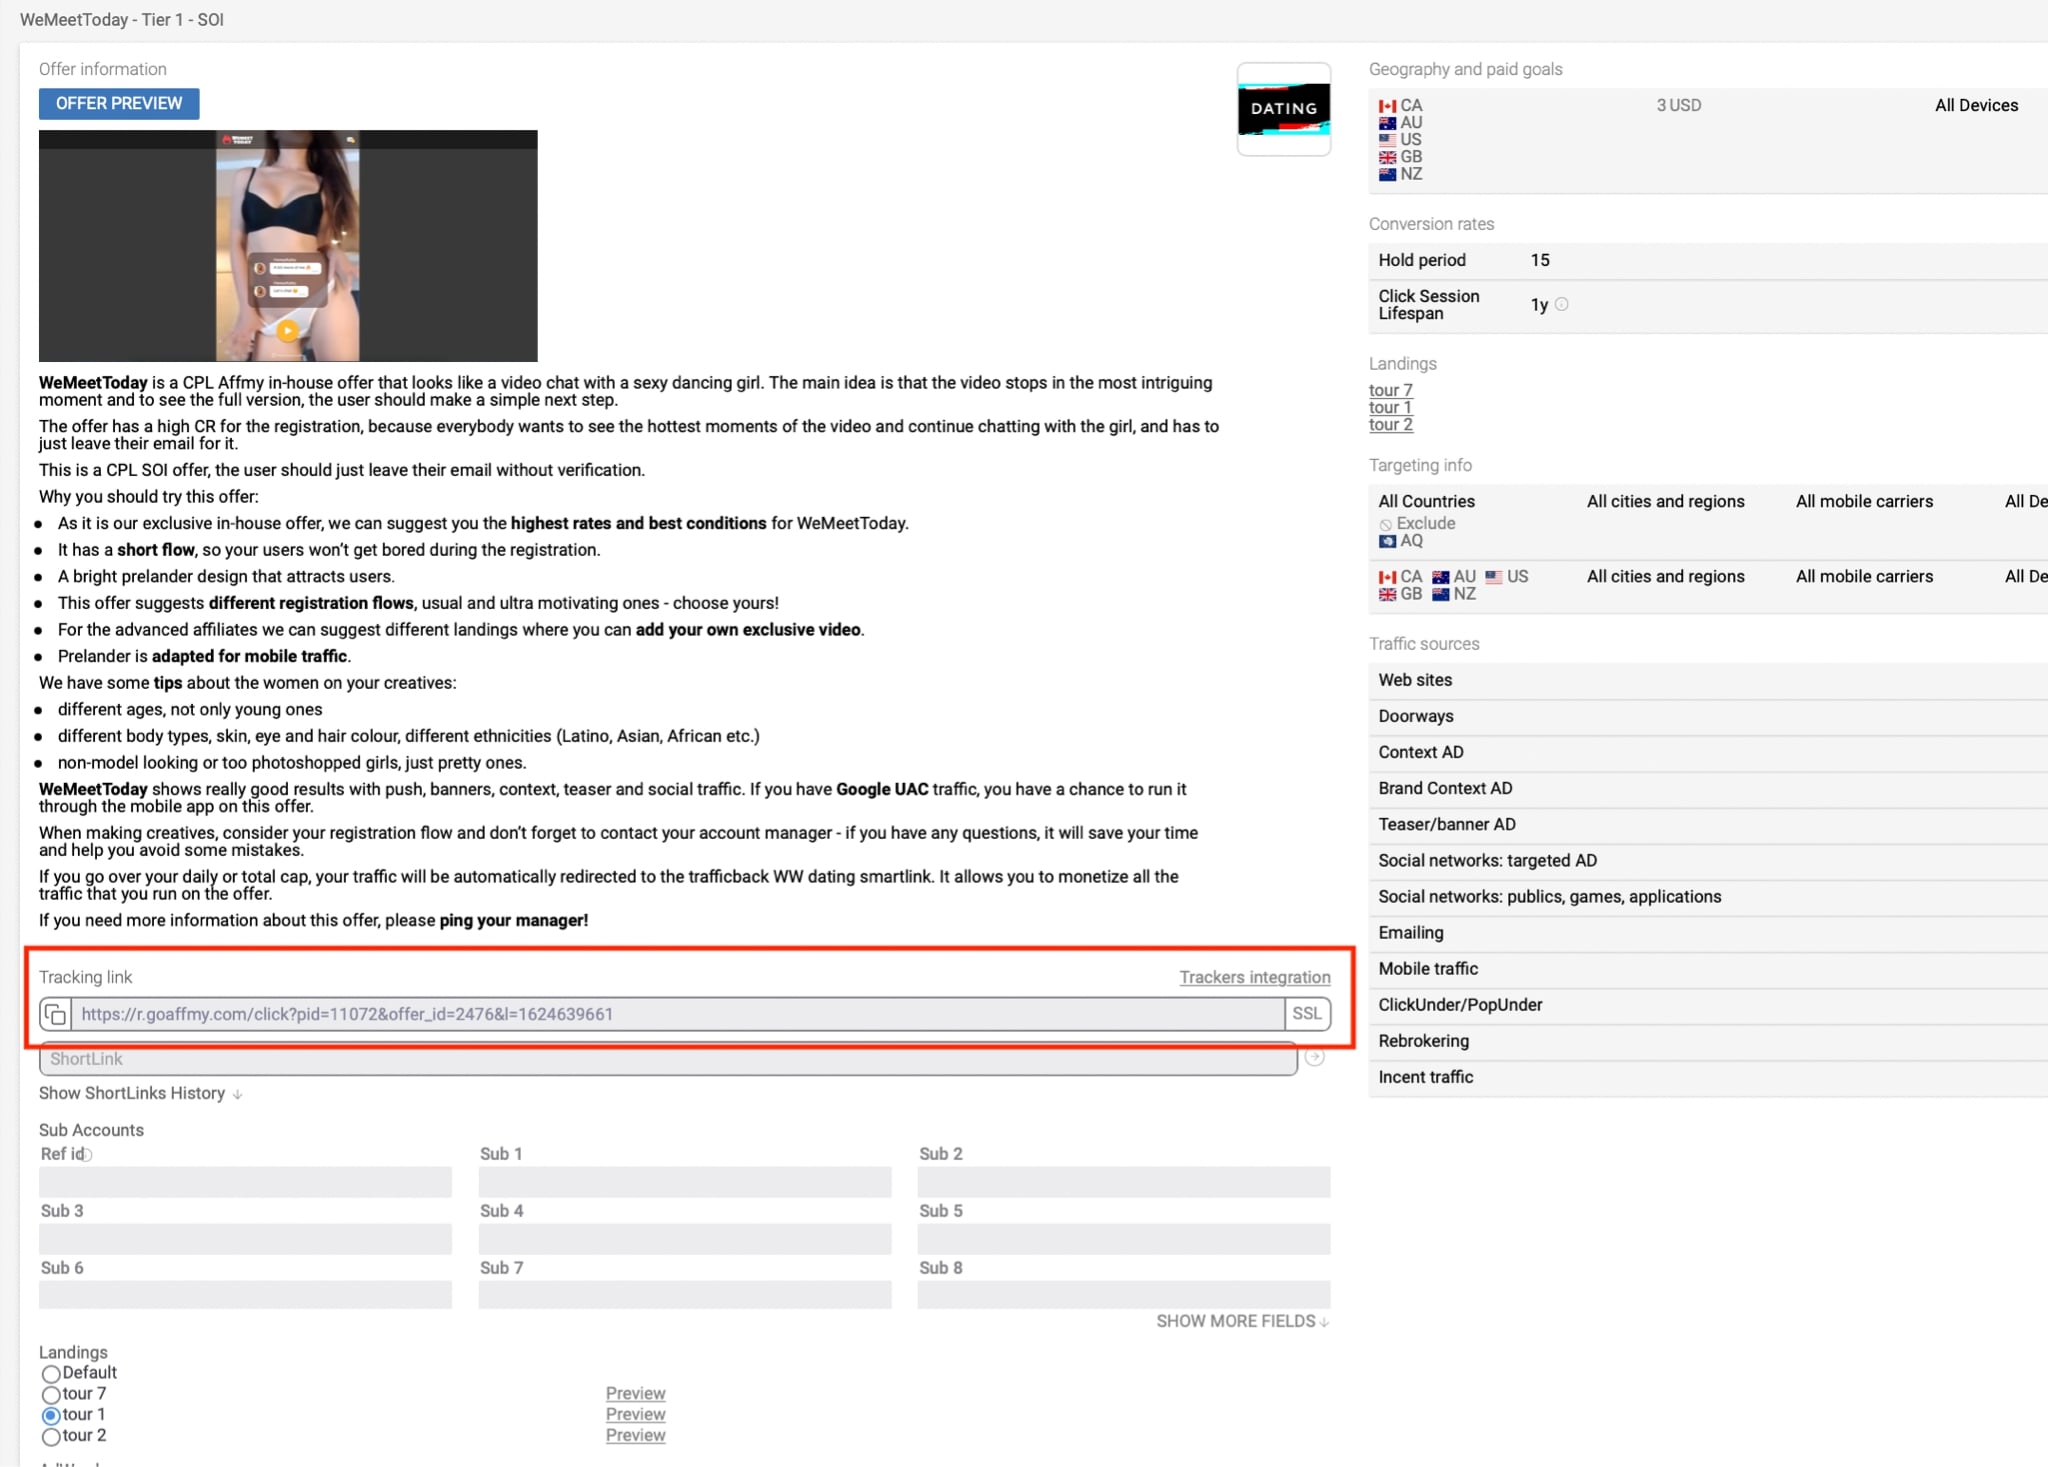
To add offers to the tracker, first of all you should open an offer in the network and copy its tracking link. In our case, there are 1 and 2 tours of WeMeetToday of Affmy. Videos, used on landing pages, differ in tours.
Then we open the tracker and create a new offer, to do it, go to “Offers” tab and click on ”Create”.

To simplify the search by stats as much as possible, you should give an easy and distinctive name of the offer and choose “Affmy” in affiliate networks. Then we paste the link from the affiliate network and save. And repeat it with all the offers, which we are going to drive.
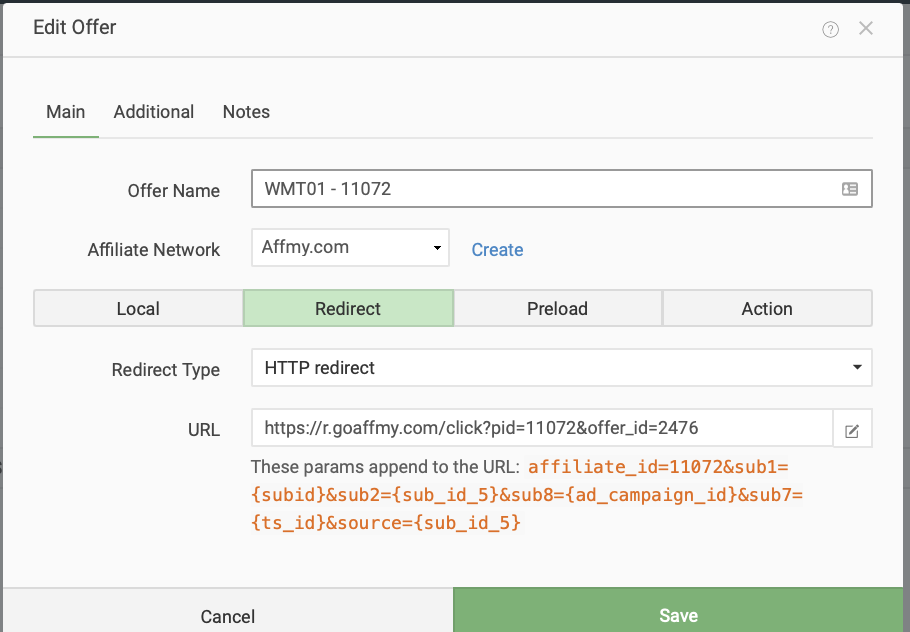
Note: HTTP redirect is set as a default, there is no need to change anything in this column. We have already written in the previous case what other types of tracking links mean.
How to set a campaign
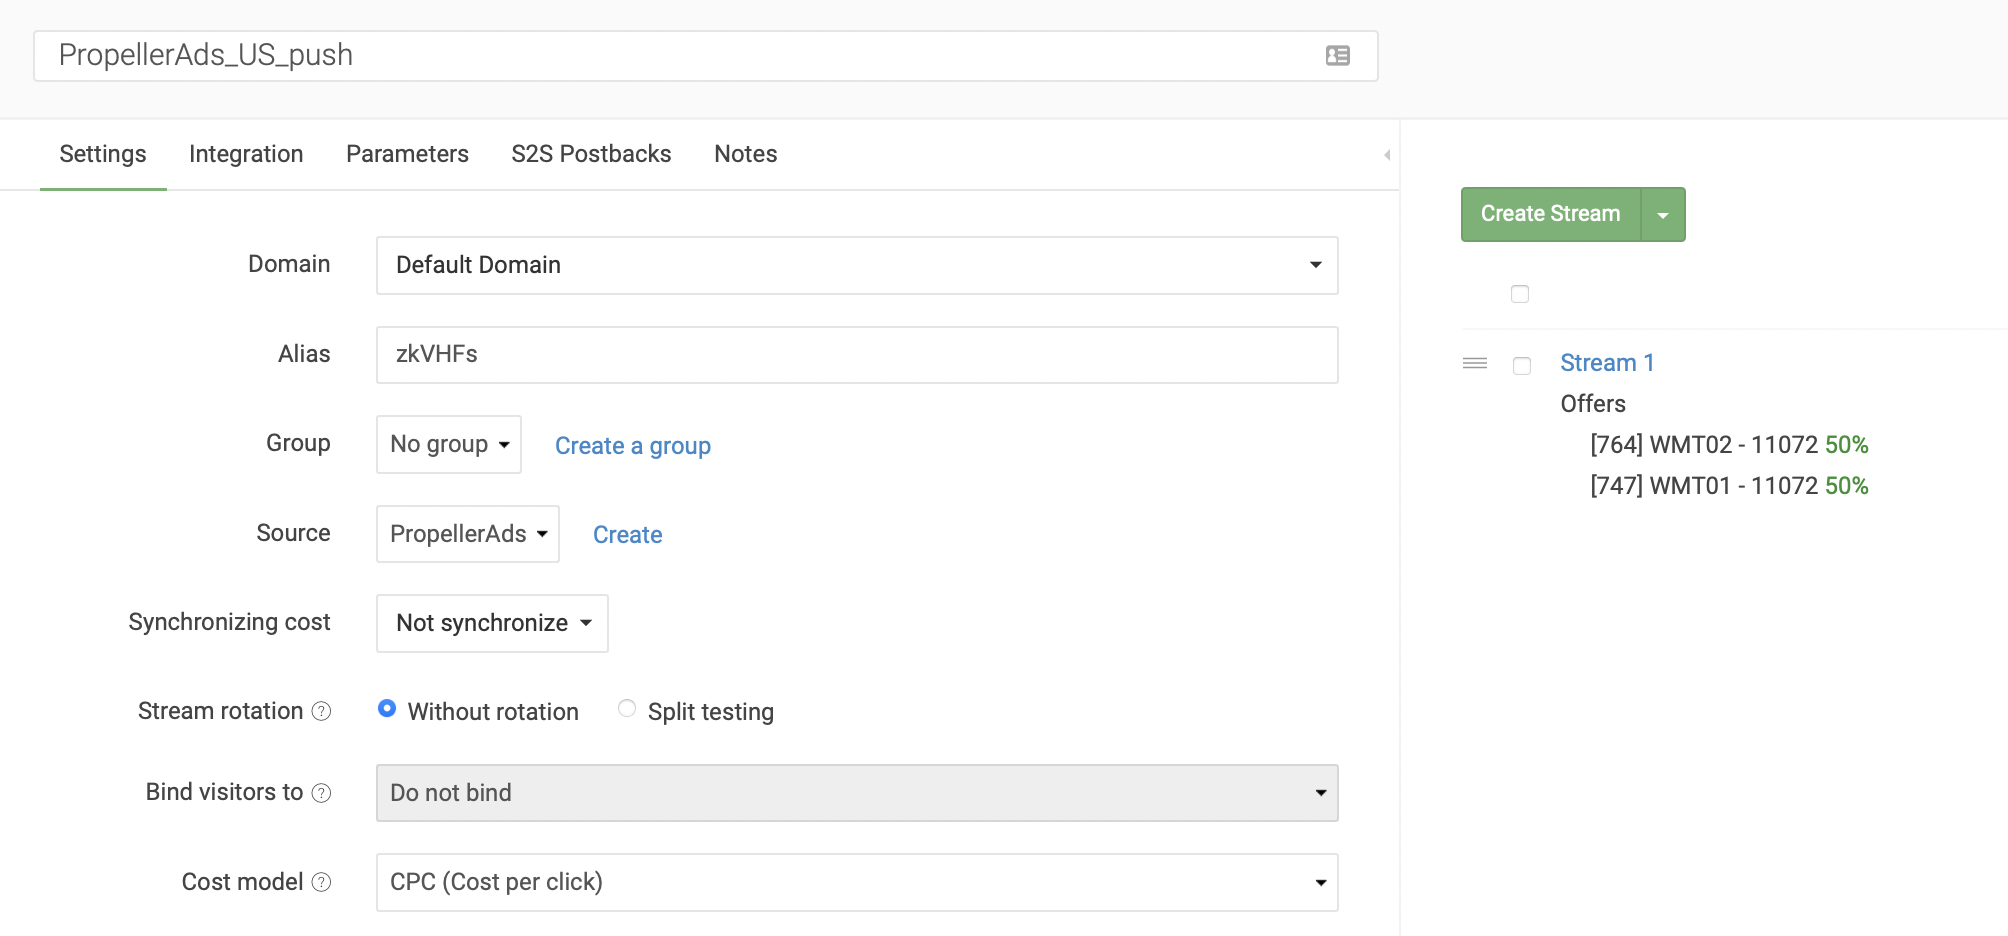
We start with creating a campaign in the tracker, to do it, go to “Campaigns” tab and click on “Create”. Then write a simple and easy name, to find the campaign in stats quickly, for example, PropellerAds_US_push. Select PropellerAds in the traffic source and click on “Create stream” in campaign settings in the right corner. We split an offer from two tours, because you should choose both of these tours in the offers and send 50% of traffic to each.
Then we create an ad campaign in PropellerAds, and to do it we click on «Create a campaign» blue button on the main page.

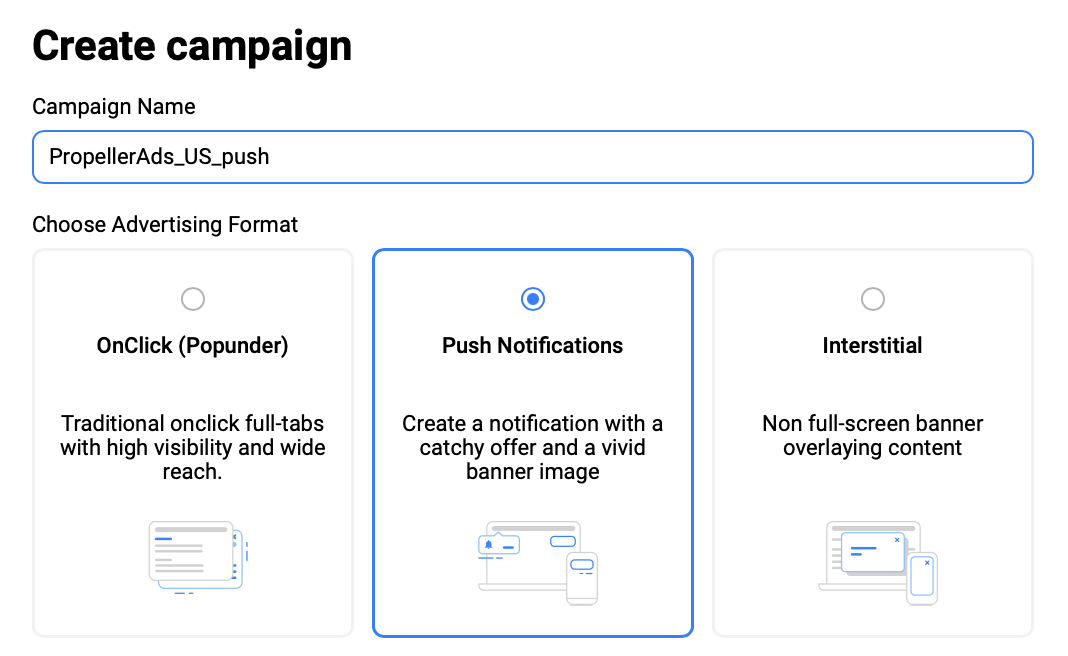
At first step, we need to write the name of the campaign and choose the ad format. We will use push ads, that’s why we choose “Push Notifications”.
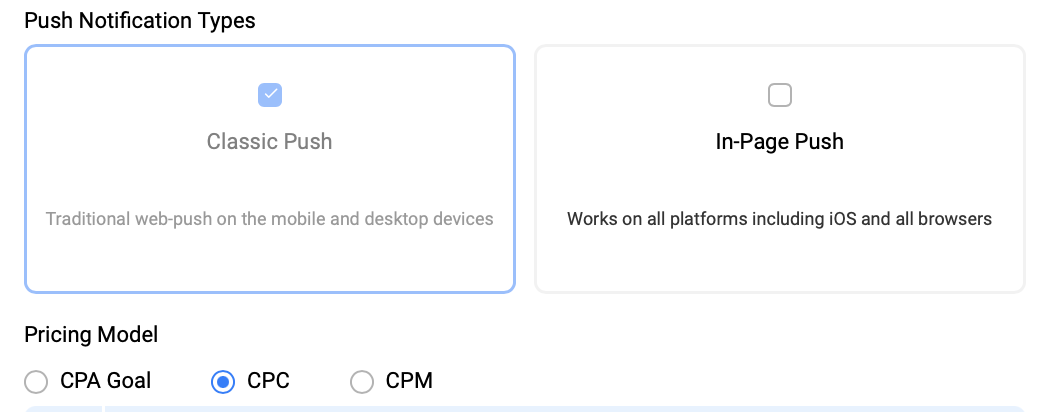
Then we choose a type of push notifications and a pay type. We will test classic push notifications only, as we are more experienced in them, and to do a test, it is better to start with the source that you know better. We choose a CPC pay type that is cost per clicks. CPM and CPA Goal are more complex and at first testing, we do not recommend using them, as we do not know yet what creatives and offers bring good CR in this network.
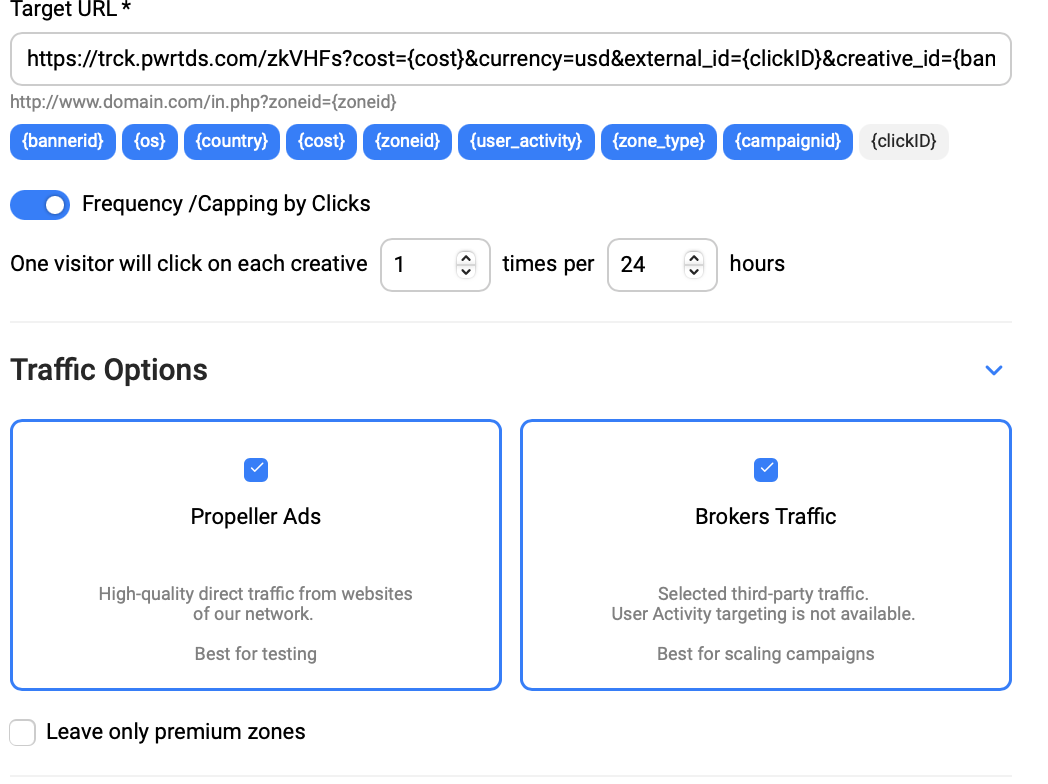
The next step is to paste the link of the campaign, which we copy from the tracker.
Then we set the frequency capping: a user clicks on every creative once per 24 hours. To test a source, such a limitation will be optimal, if you set a more frequent capping, a user may be fed-up with ads.
We leave both groups in the traffic parameters: all traffic and the traffic of partners (broker traffic). So we will not limit its volume.
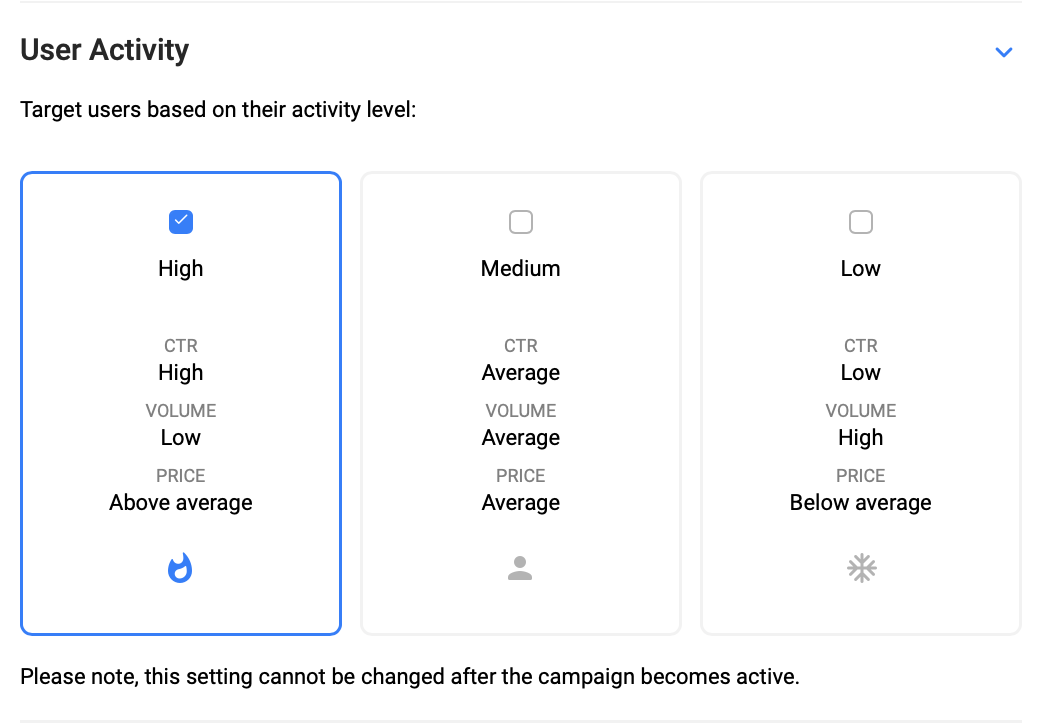
Then we choose groups of users according to their activity. The network gives us 3 variants: high, medium, low. We test all 3 groups separately from each other. The plan of campaign creation is the following: four campaigns for every group of user activities with different creatives.
Then we choose countries, in our case - the United States.
The minimum CPC for the USA – $0.03. That’s why we choose for low user activity - $0.03, medium – $0.04, high – $0.05. Such a break up will reflect the correspondence of traffic cost on user activity given by the ad network.
We will not target by city or state in order not to cut the traffic volume.
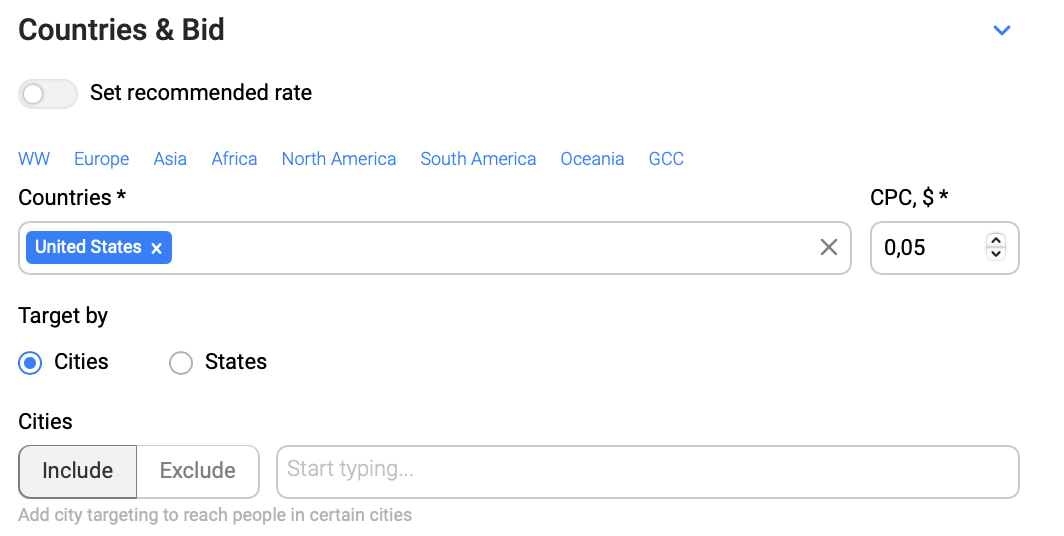
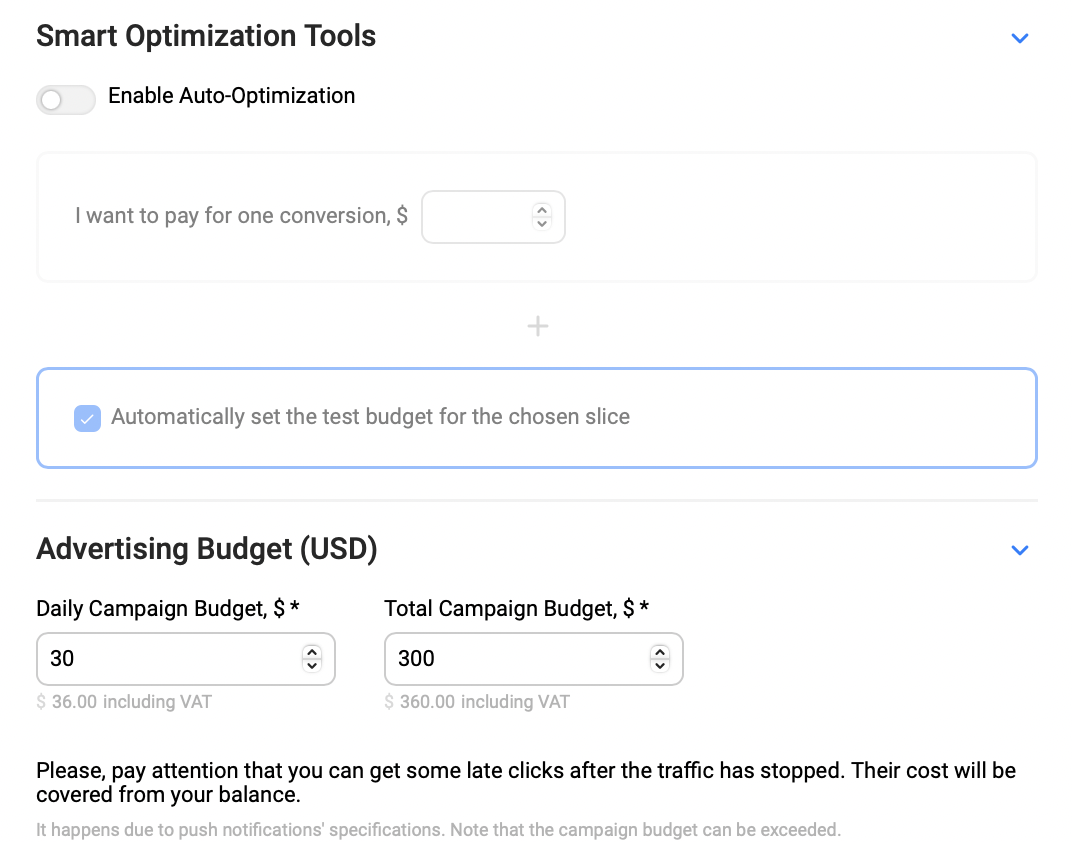
We do not use smart tools for optimization since it claims more complex CPA settings, which is better to test after the first drive of campaigns in the source.
We set the daily budget - $30, the total budget – $300. In 24 hours after the traffic was driven, we monitor the spent sums and if needed correct daily budget. We change the total budget, if we decide to drive more traffic to campaigns.
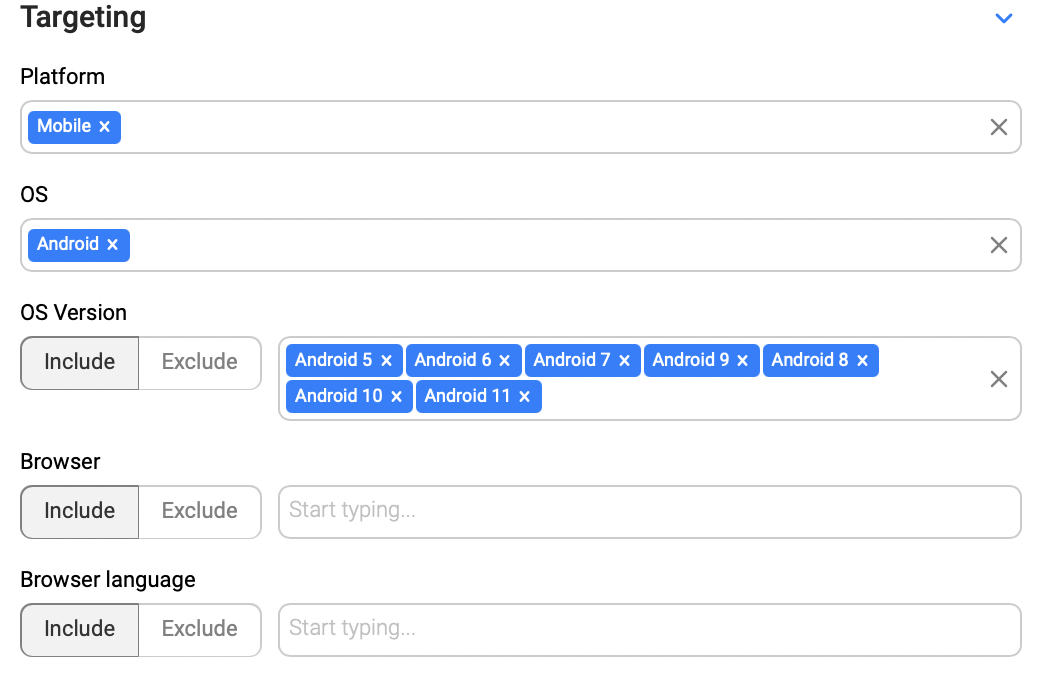
Then let’s see the targeting section. We choose a “mobile” platform: concerning our experienceу push ads work better on mobile devices.
Previously we chose classic push ads, the system offers us only Android. We set from 5 to 11 versions, as previous versions are used on old devices and bring practically no CR.
The name and language of the browser should not be defined: at first launch, there is no need in such a challenging setting, because they can decrease the audience very much.
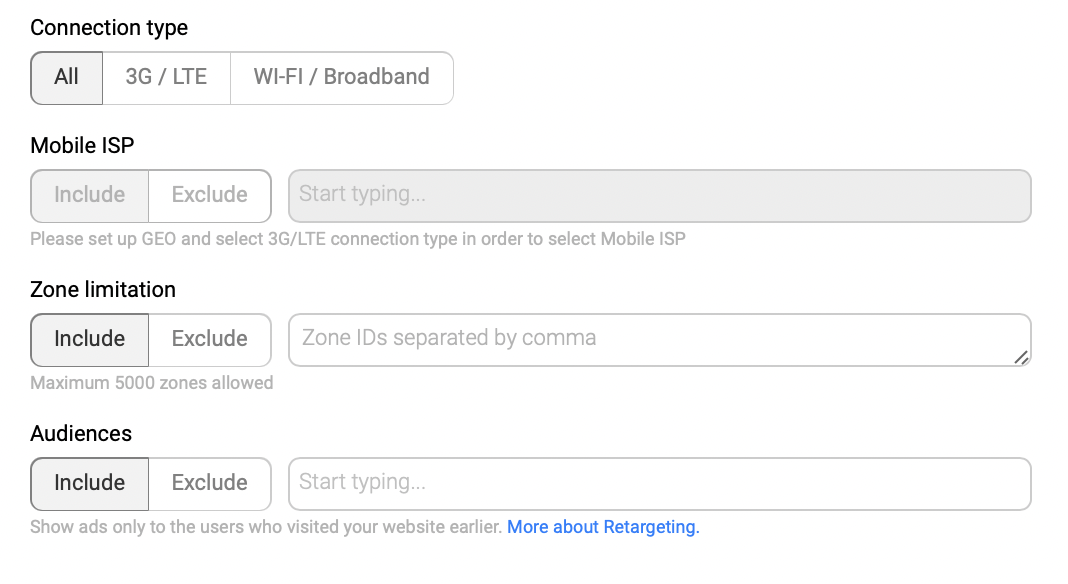
We keep all types of connection, not to limit the traffic, so we do not have access to mobile provider settings.
We set the limits according to zones, when we drive traffic and create black lists for the chosen GEO.
The audience – is the groups of users, collected before due to retargeting. As we haven’t done it, we skip this setting.
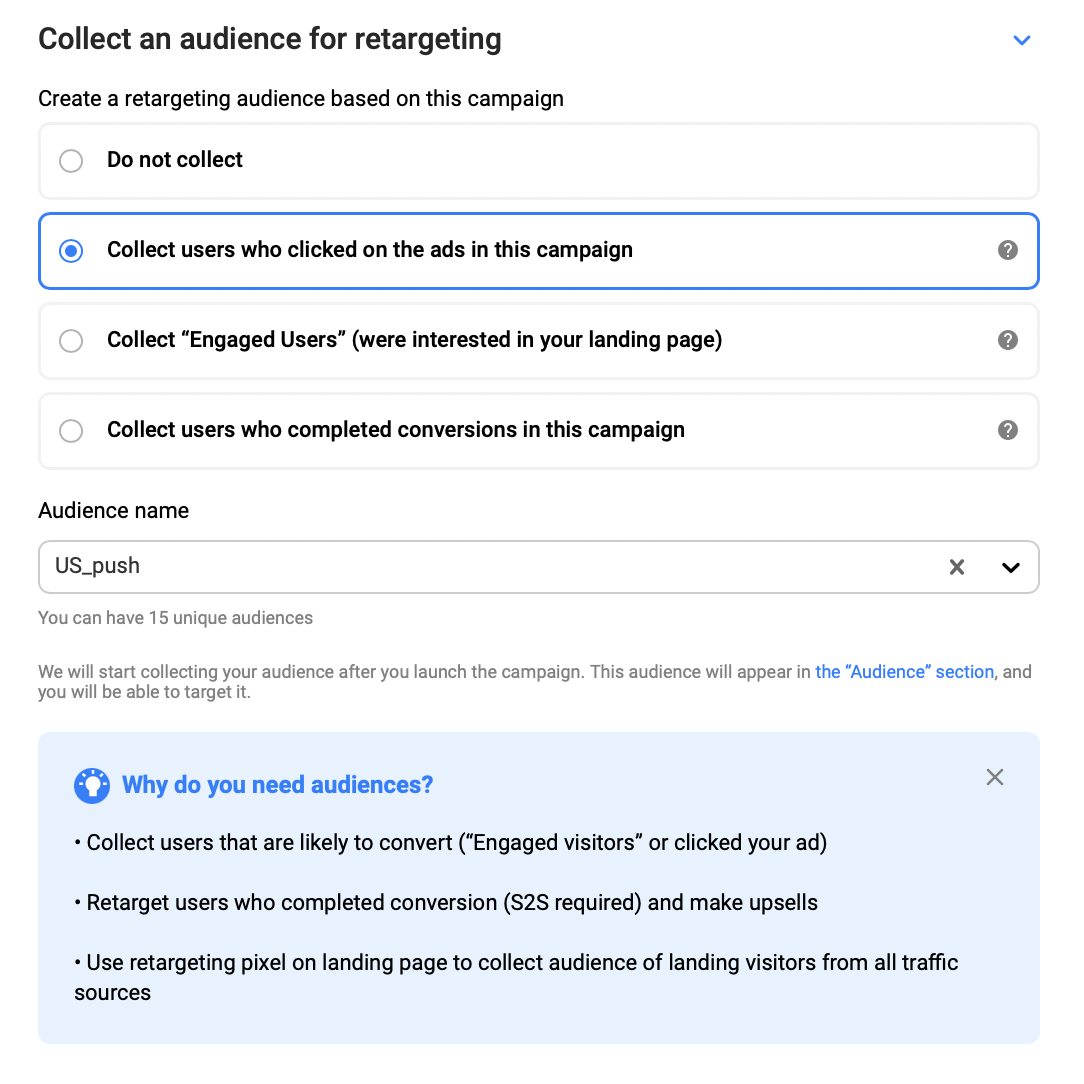
As there is a function of collecting the audience in the network, we use it to test it in future if there is a need. We are interested in the users who clicked on the ad, that is they were interested in it. As a result, we will have a group of people, to whom we can launch new ad campaigns.
We name the audience as US_push, so that it would be convenient to monitor. We are going to collect the audience from all the campaigns to the one group.
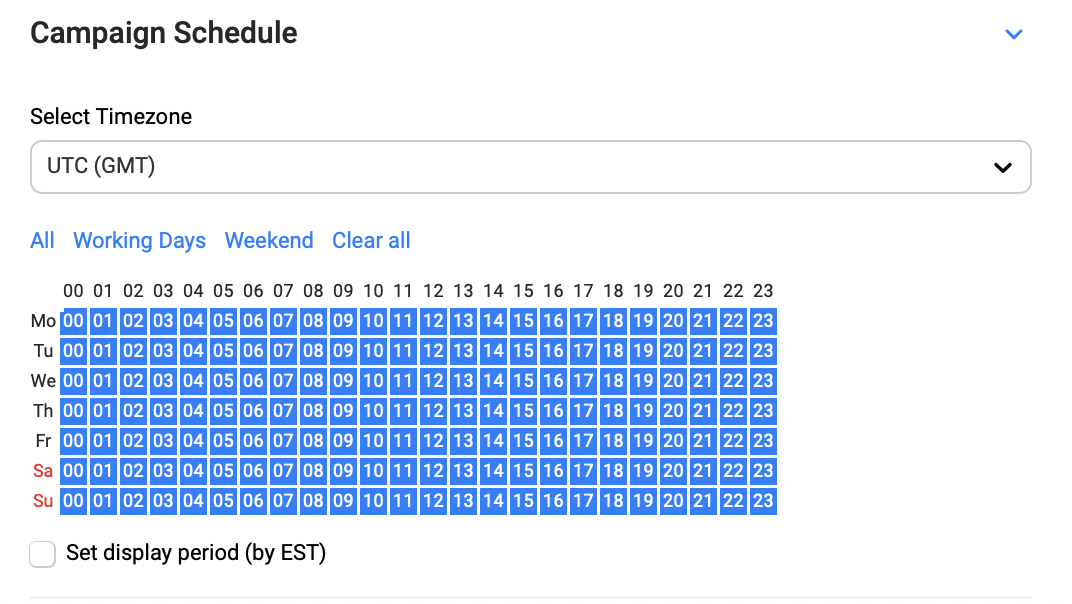
The campaign runs 24 hours 7 days a week, and if after the first tests we see a large variation in CR during the day, we are going to set targeting according to certain days and hours.
We set the time zone as UTC (meaning UTC +00:00), as the tracker is set according to the same time zone.
Further we add a creative, you can see the example on the screenshot below. We recommend making creatives similar to real notifications. You should use a question or an offer to get acquainted closer, so that it motivates the user to click on this ad.
Keep in mind that a creative of a push ad consists of 2 pictures – a square icon and a rectangular image, a title (no more than 30 characters) and the main text (up to 45 characters). We usually put a name and an age in the title, less often - location, and a provoking message in the text more often.
We create a creative per every campaign and 4 campaigns per every group of user activity, as a result we will have 12 campaigns. You can ask Affmy managers to provide you with examples of relevant creatives for a certain GEO.

The first statistics summary and optimization
We have got the first period of stats monitoring in 24 hours after the start to analyze the traffic and to correct targeting if needed.
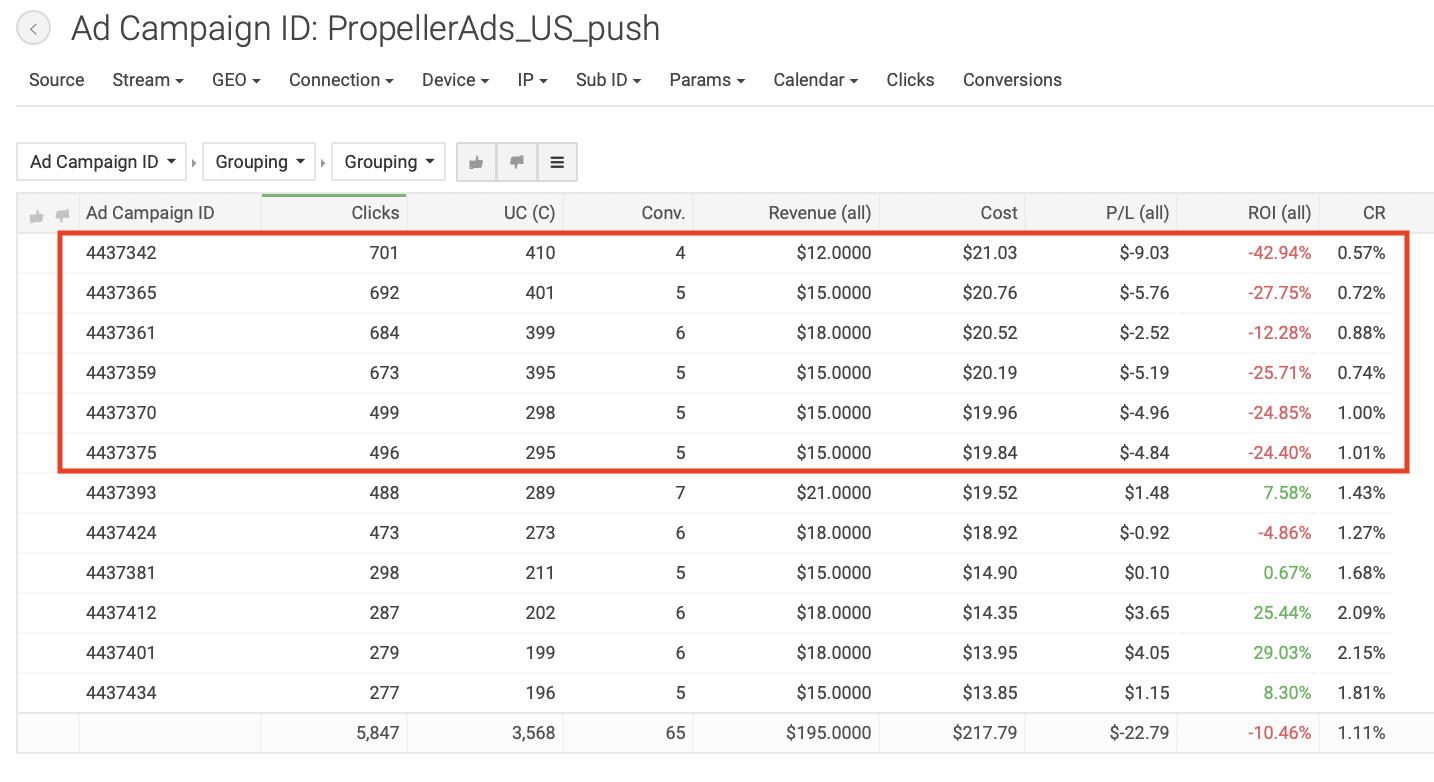
We got ROI -10,46% for the first day, and it means that it is necessary to optimize the campaigns according to different sections.
First we monitor the statistics according to offers. Mind that we drove 2 tours of WeMeetToday, and each of them have got approximately the same ROI and CR.

Then we check the stats by groups of user activity. Only the “high” group gave positive ROI, that’s why we can conclude that this group has the most qualified traffic.
The group of users with low activity gave the lowest CR and ROI, that’s why we switch it off but before doing it we monitor all the groups sorted by campaigns, to make sure that all the ad campaigns in “low” segment run negative metrics.

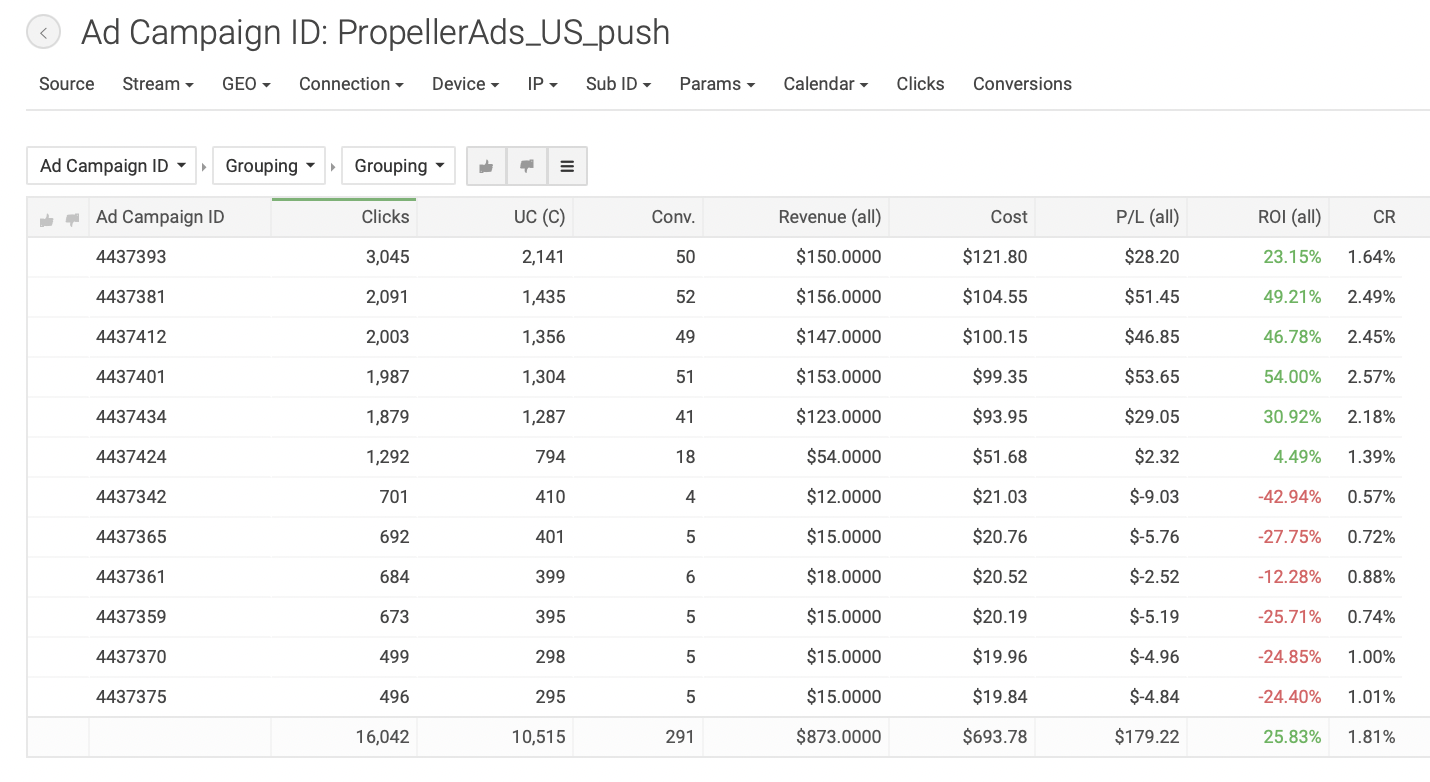
Having monitored the statistics by campaigns we defined that the first 4 campaigns (it’s “low” group on the screen) further we have 4 ad campaigns from “medium” group, and the left four is “high” group.
Now we have made sure that all the campaigns of the “low” group can be switched off, as they drove with the lowest possible rate. We switched 2 ad campaigns from the “medium” group with -24,85% ROI and -24,40%, as their data is much worse compared to the other campaigns.
We set $30 a daily budget to every ad campaign. At the moment of optimization (in a day) the campaigns spent from $13 to $21, that’s why we increase the daily budget up to $50, so that they won’t run out of money.
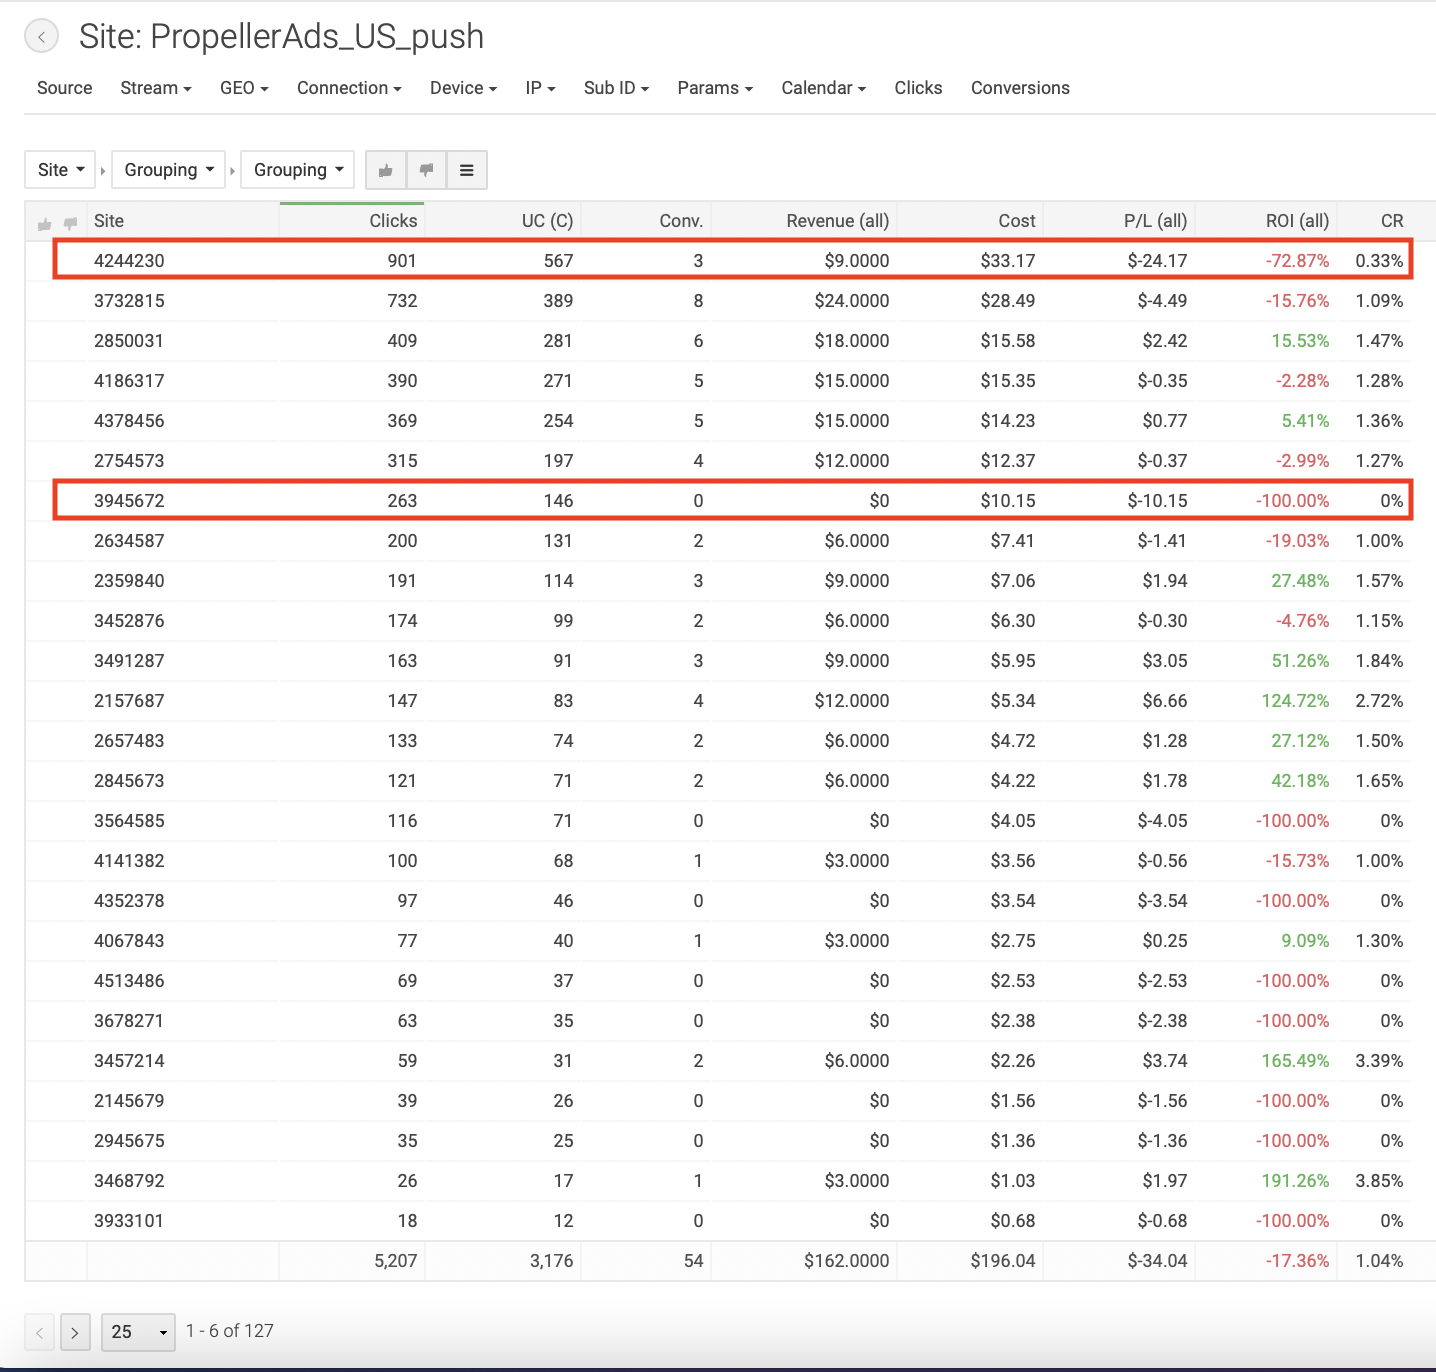
Then we optimized by zones: campaigns drove to 127 zones, you can see the first 25 zones, we sorted them by clicks from the maximum amount to the minimum.
We switch off 2 zones from the presented 25 with ROI lower than 50% and click amount more than 200. You should regularly monitor the stats by zones and switch off the unprofitable ones.
The second statistics summary and optimization
After 3 days from the ad campaign launch, we made one more optimization.
1 tour offers runs ahead 2 tours, but not to a great extent, that’s why we keep both offers and continue driving traffic.

The stats according to user activity has changed, but ranking is the same. “Medium” group got a positive ROI, but still it is behind the “high” group, that’s why we monitor stats summary by campaigns again, to decide whether to switch off the group.

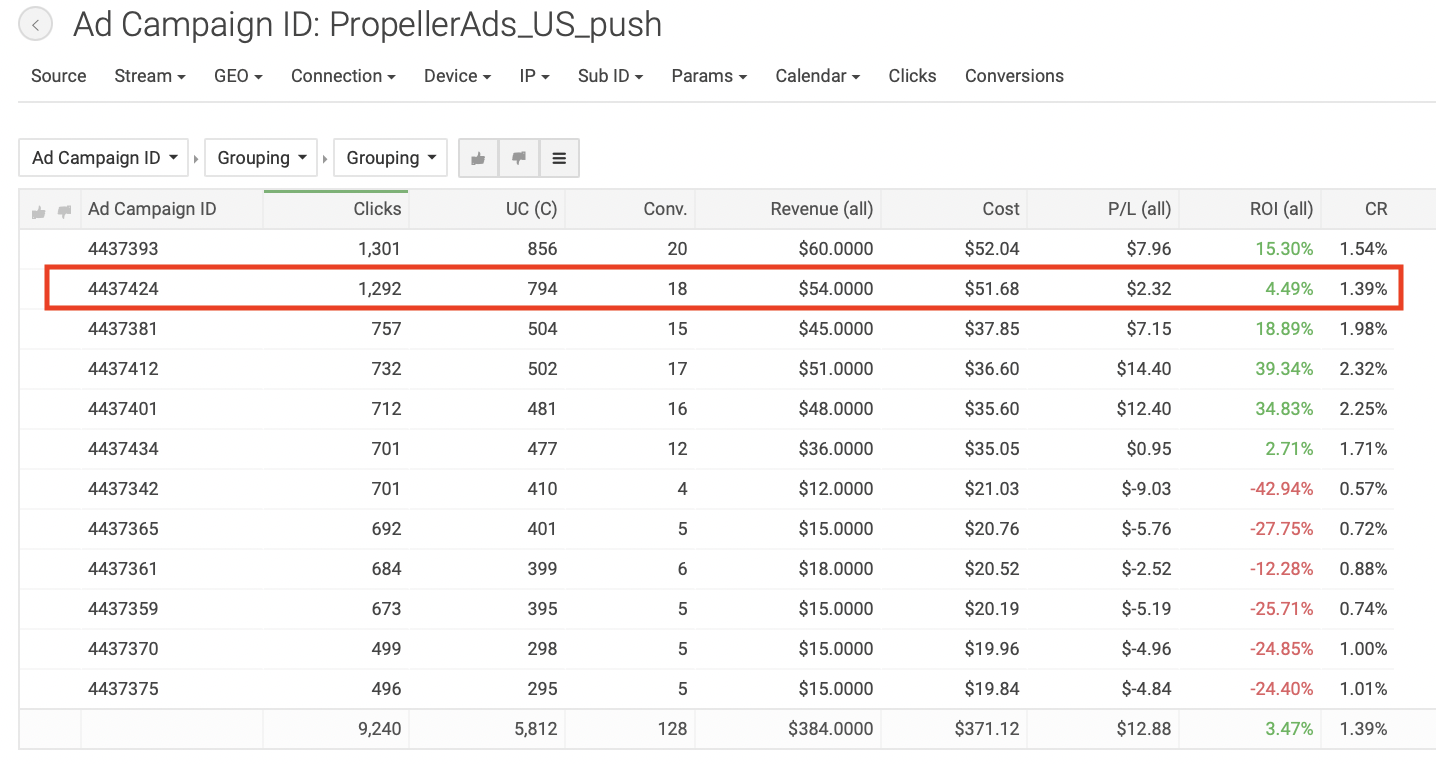
We noticed that 2 ad campaigns from the “medium” group get more traffic and give positive ROI, in statistics sorted by campaigns, but 4437424 has lower metrics, that’s why we switch off this campaign (its stats is marked with red color on the screenshot).
Having analyzed ad campaigns from the “high” group, we decided not to switch off any campaign. The 4437434 campaign, despite of the low ROI, showed CR = 1,71%, and it’s higher than ad campaigns from the “medium” group have.
From this moment, we will drive traffic to 4 campaigns from the “high” group and 1 from “medium” group.
Let’s go to optimizations by zones. As you can see from the screenshot below, we have a bit different zones, which make the first 25 from our list. It means that some sources began to give us less traffic, that’s why the others started giving more clicks. The switched off zones are marked with orange color. During the current optimization we add to the blacklist one more source, marked with red color, as it has more than 600 clicks and has a loss of $8, and CR is lower than the other sources with the same amount of clicks.
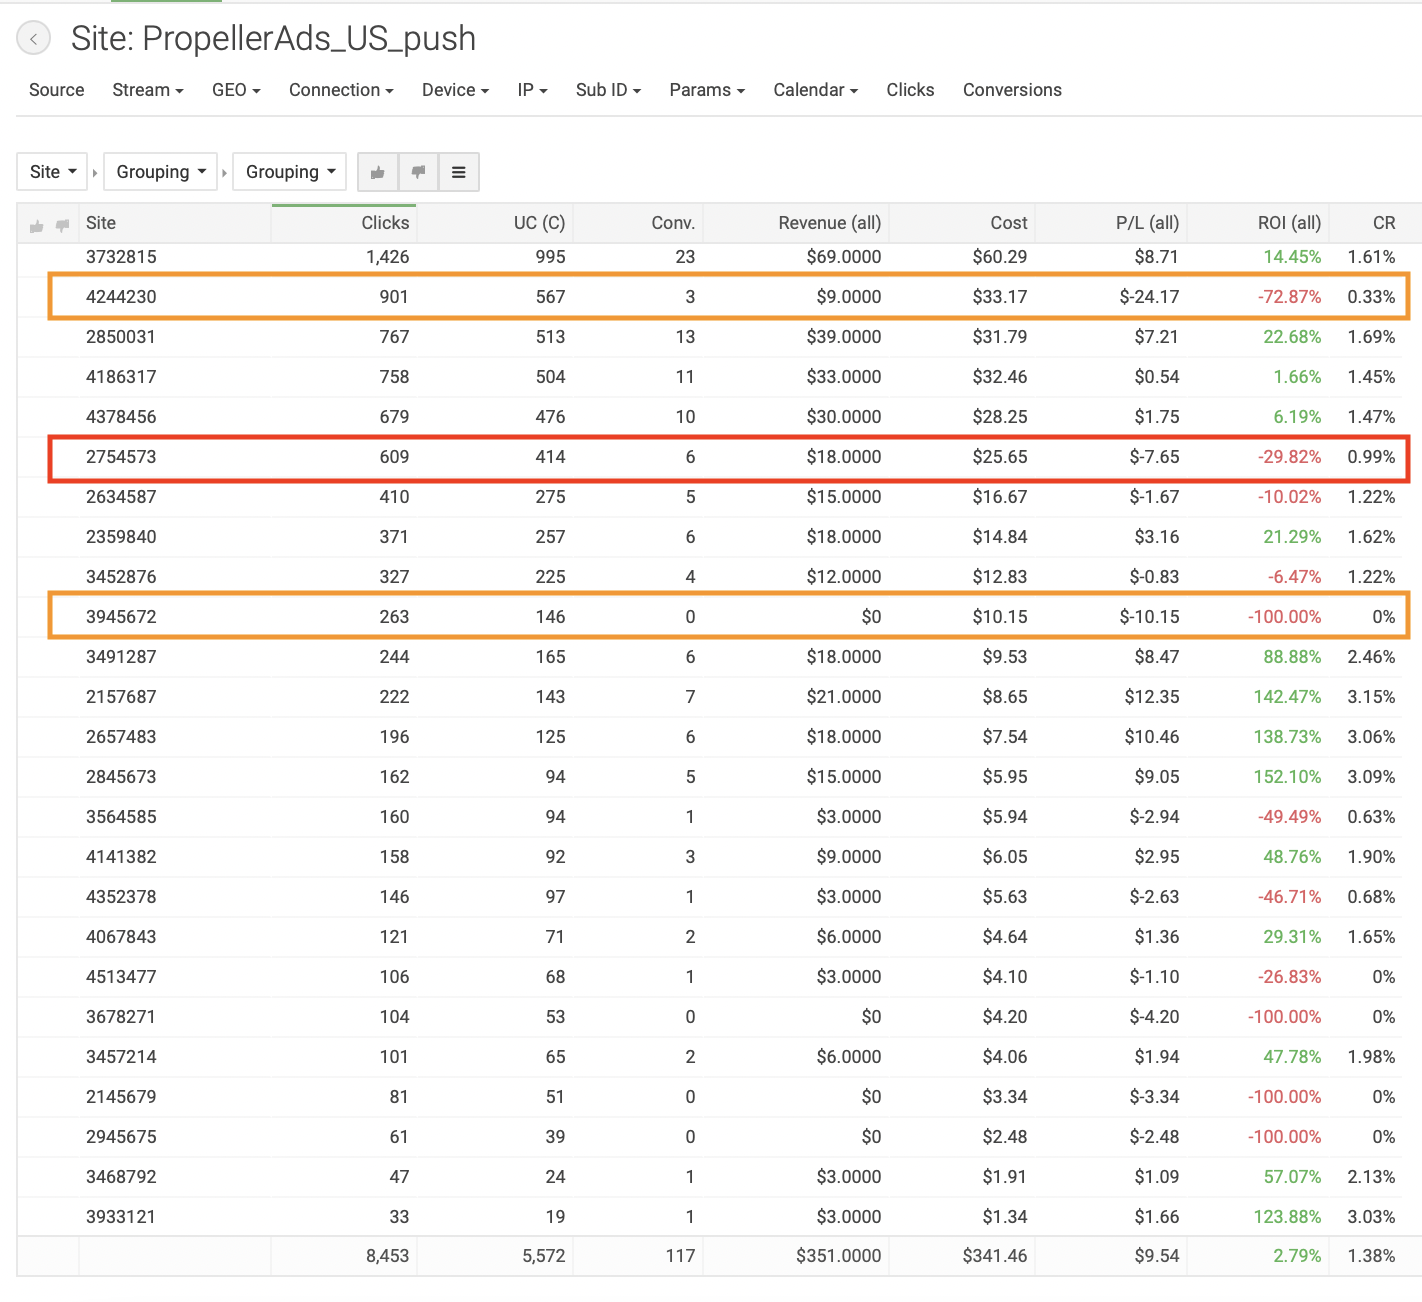
We are going to drive campaigns 11 days more, checking the statistics sorted by zones once in a while not to miss the moment when it is high time to put other sources into the blacklist.
The third summary of statistics
Since 11 days have passed, it’s time to summarize. We got the following results for 2 weeks:
Clicks: 16042
Conversions: 291
Cost: $693.78
Revenue: $873
Profit: $179.22
ROI 25,83%
ROI data sorted according to offers is the following:
WeMeetToday 1 tour – 22,26%.
WeMeetToday 2 tour – 29,49%.
As we remember from the previous optimization, the first tour was a bit better than the second one, but now the situation has changed. It means that the offers in general are the same efficient and there is no need to switch off any of them.

ROI data sorted by user activity is the following:
“High” group – 45,48%.
“Medium” group – 9,71%.
“Low” group – -27,27%.
As we can see the high user activity group had again the highest metrics. In our opinion, it’s also possible to run the “medium” group, using other creatives or decreasing the CR.

Maximum ROI in the “high” group – 54,00%.
Maximum ROI in the “medium” group – 23,15%.
Only 1 from 4 campaigns of the “medium” user activity group could compete with campaigns of the “high” user activity group.
Advice and recommendations.
Having analyzed the statistics of this case, we decide to give advice and recommendations, which will be very useful:
● The best results show the “high” user activity group. Test creatives and CR to find the optimal for high ROI and CR.
● To understand which creative has better CR, use photos of different stylistics and texts.
● The both tours of WeMeetToday ran с высокими показателями, значит они одинаково эффективны в данном источнике.
● Add just one creative to every campaign, to optimize them with the help of bid change.
● You should definitely use a tracker, because it is convenient to analyze the stats and to optimize ad campaigns according to different data to increase the profit.
● Do split tests of your offers and pre-landers to define which one is the most converting
● Use scaling, when you launch campaigns in other GEOs to get more profit.
● Contact the managers of affiliate and ad networks and use their advice to improve the quality of traffic.
